
Health check
개요
application을 운영하다 보면 우리가 예상할 수 없는 상황이 발생하곤 합니다. 개발자의 잘못인 경우도 있고, 시스템의 불안정함 때문일수도 있습니다. 그러나 중요한 점은 어떠한 상황에서도 서비스는 정상적으로 운영되어야 하며, 문제가 발생할 경우 빠르게 파악하고 처리해야 한다는 점입니다.
Health check
많은 서비스에서 health check라는 api를 작성하여 이것을 app 실행 전.중.후에 파악하는 용도로 사용합니다. health check api는 특별한 것이 아니고 현재 app 상태가 정상인지 확인하면 됩니다. 아래는 아주 간단한 형태의 api 예시입니다.
@RestController
@RequestMapping("/api/v1")
class HomeController {
    @GetMapping("/hello")
    fun home(): ResponseEntity<String> = ResponseEntity.ok()
        .cacheControl(CacheControl.noCache())
        .body(LocalDateTime.now().toString())
}
빠르게 파악해야 하기에 외부에 노출해도 상관없는 형태가 좋습니다. 서버의 시간을 알려주는 예시이며 web에서 cache를 사용하지 않게 설정합니다.
spring actuator
spring을 사용한다면 spring actuator 모듈을 사용하여 보다 간편하게 그리고 spring과 통합하여 사용할 수 있습니다. 패키지 설정 후 기본적인 설정을 하지 않았다면 두 개의 end-point로 확인할 수 있습니다.
GET http://localhost:8080/actuator/

{
	"_links": {
		"self": {
			"href": "http://localhost:8080/actuator",
			"templated": false
		},
	"health": {
			"href": "http://localhost:8080/actuator/health",
			"templated": false
		},
	"health-path": {
			"href": "http://localhost:8080/actuator/health/{*path}",
			"templated": true
		}
	}
}

GET http://localhost:8080/actuator/health
{
	"status": "UP"
}
property를 수정하여 추가적인 정보를 외부에 노출 할 수 있습니다.
management:
  endpoint:
    health:
      show-details: always
  info:
    env:
      enabled: true
  endpoints:
    web:
      exposure:
        include: health,info,env,beans, metrics
exposure에 설정된 endpoint가 노출됨을 확인할 수 있습니다.
{
  "_links": {
    "self": {
      "href": "http://localhost:8080/actuator",
      "templated": false
    },
    "beans": {
      "href": "http://localhost:8080/actuator/beans",
      "templated": false
    },
    "health": {
      "href": "http://localhost:8080/actuator/health",
      "templated": false
    },
    "health-path": {
      "href": "http://localhost:8080/actuator/health/{*path}",
      "templated": true
    },
    "info": {
      "href": "http://localhost:8080/actuator/info",
      "templated": false
    },
    "env": {
      "href": "http://localhost:8080/actuator/env",
      "templated": false
    },
    "env-toMatch": {
      "href": "http://localhost:8080/actuator/env/{toMatch}",
      "templated": true
    },
    "metrics-requiredMetricName": {
      "href": "http://localhost:8080/actuator/metrics/{requiredMetricName}",
      "templated": true
    },
    "metrics": {
      "href": "http://localhost:8080/actuator/metrics",
      "templated": false
    }
  }
}
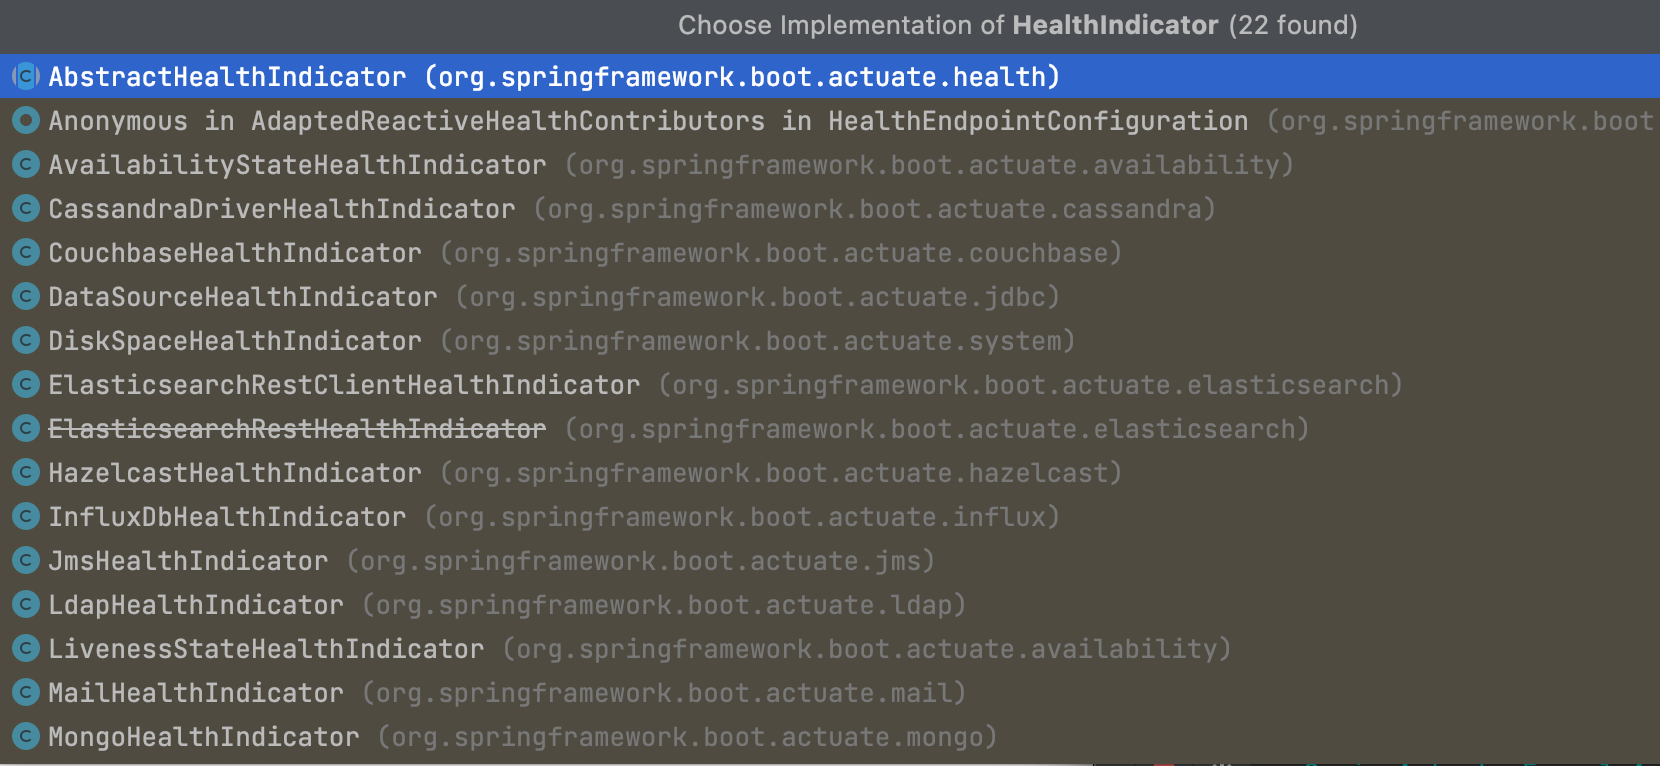
spring과의 통합은 단순히 bean형태로 제공한다는 의미를 넘어서 application을 구성 또는 관련한 다양한 내용들에 대한 구현체를 제공한다는데 의미가 있습니다. HealthContributor인터페이스를 보면 내부적으로 아래와 같이 다양한 구현체가 미리 제공됨을 확인할 수 있습니다.
spring boot starter를 이용하면 자동으로 health indicator를 구현하게 되고 application 전반에 걸쳐 health check를 진행할 수 있습니다. 아래는 spring-boot-starter-data-jpa를 적용한 후 모습입니다.
http://localhost:8080/actuator/health/db

{
  "status": "UP",
  "details": {
    "database": "MySQL",
    "validationQuery": "isValid()"
  }
}
Health
health는 단순한 상태를 의미하지 않습니다. up, down상태가 존재하며 하나의 컴포넌트라도 down일 경우 http status code 503을 반환합니다. 서비스에 따라서는 일부 시스템이 down 되어도 정상적으로 운영되어야 할 상황이 있을 수 있는데 property를 수정하여 disable 할 수 있습니다.
health:
    db:
      enabled: false
위와 같이 작성한 경우 endpoint도 노출되지 않으며, health check에서도 영향을 주지 않습니다.
Custom Health Check
경우에 따라선 spring에서 제공하는 HealthContributor 외에도 커스텀하게 관리해야 할 경우가 있습니다. 예를 들어 application warm up을 하거나, MSA 환경에서 connection을 점검하는 경우가 있을 것 같습니다. 아래는 ApplicationListener를 설정하여 application loading이후 커스텀하게 health check를 설정하는 로직입니다.
@Component
class AppInit(
    private val appInitChecker: AppInitChecker
) : ApplicationListener<ApplicationReadyEvent> // ... (1)
{
    override fun onApplicationEvent(event: ApplicationReadyEvent) {
        // check something... (2)
        appInitChecker.afterWarmUp()
    }
}

@Component
class AppInitChecker : HealthIndicator // ...(3)
{
    private val healthIndicator = // ...(4)
        AtomicReference(Health.down().build())

    override fun health(): Health = healthIndicator.get()

    fun afterWarmUp() {
        healthIndicator.set(Health.up().build())
    }
}
- (1):
ApplicationReadyEventinterface 를 구현합니다. - (2): 검사가 필요한 항목들을 실행후
afterWarmUp()을 호출합니다. - (3):
HealthIndicator를 구현합니다. - (4):
AtomicReference를 통해 thread-safe하게 구현합니다.
GET http://localhost:8080/actuator/health/

{
  "status": "UP",
  "components": {
    "appInitChecker": {
      "status": "UP"
    }
  }
}
설정 후 app 실행 시 정상적으로 등록된 것을 확인할 수 있습니다.
With Prometheus
spring actuator를 사용하면 단순히 health check외에도 시각화 툴과 연계하여 모니터링 용도로 사용 가능합니다.
management:
  endpoints:
    web:
      exposure:
        include: prometheus
application.yaml에 prometheus를 추가합니다.
global:
  scrape_interval: 10s
  evaluation_interval: 1m

  external_labels:
    monitor: 'monitor for actuator'

scrape_configs:
  - job_name: 'monitor for actuator'
    metrics_path: '/actuator/prometheus' #...(1)
    static_configs:
      - targets: ['host.docker.internal:8080'] #...(2)
Prometheus설정을 위해 위와 같이 작성합니다.
- (1): end-point를 설정합니다. 특별한 설정이 없다면
/actuator/prometheus설정합니다. - (2): metric를 수집할 host를 설정합니다.
$ docker run -d -p 9090:9090 -v \
${path}/prometheus.yml:/etc/prometheus/prometheus.yml \
--name prometheus prom/prometheus
이때 주의할 점은 prometheus.yml의 경우 경로를 절대값으로 설정해야 합니다.
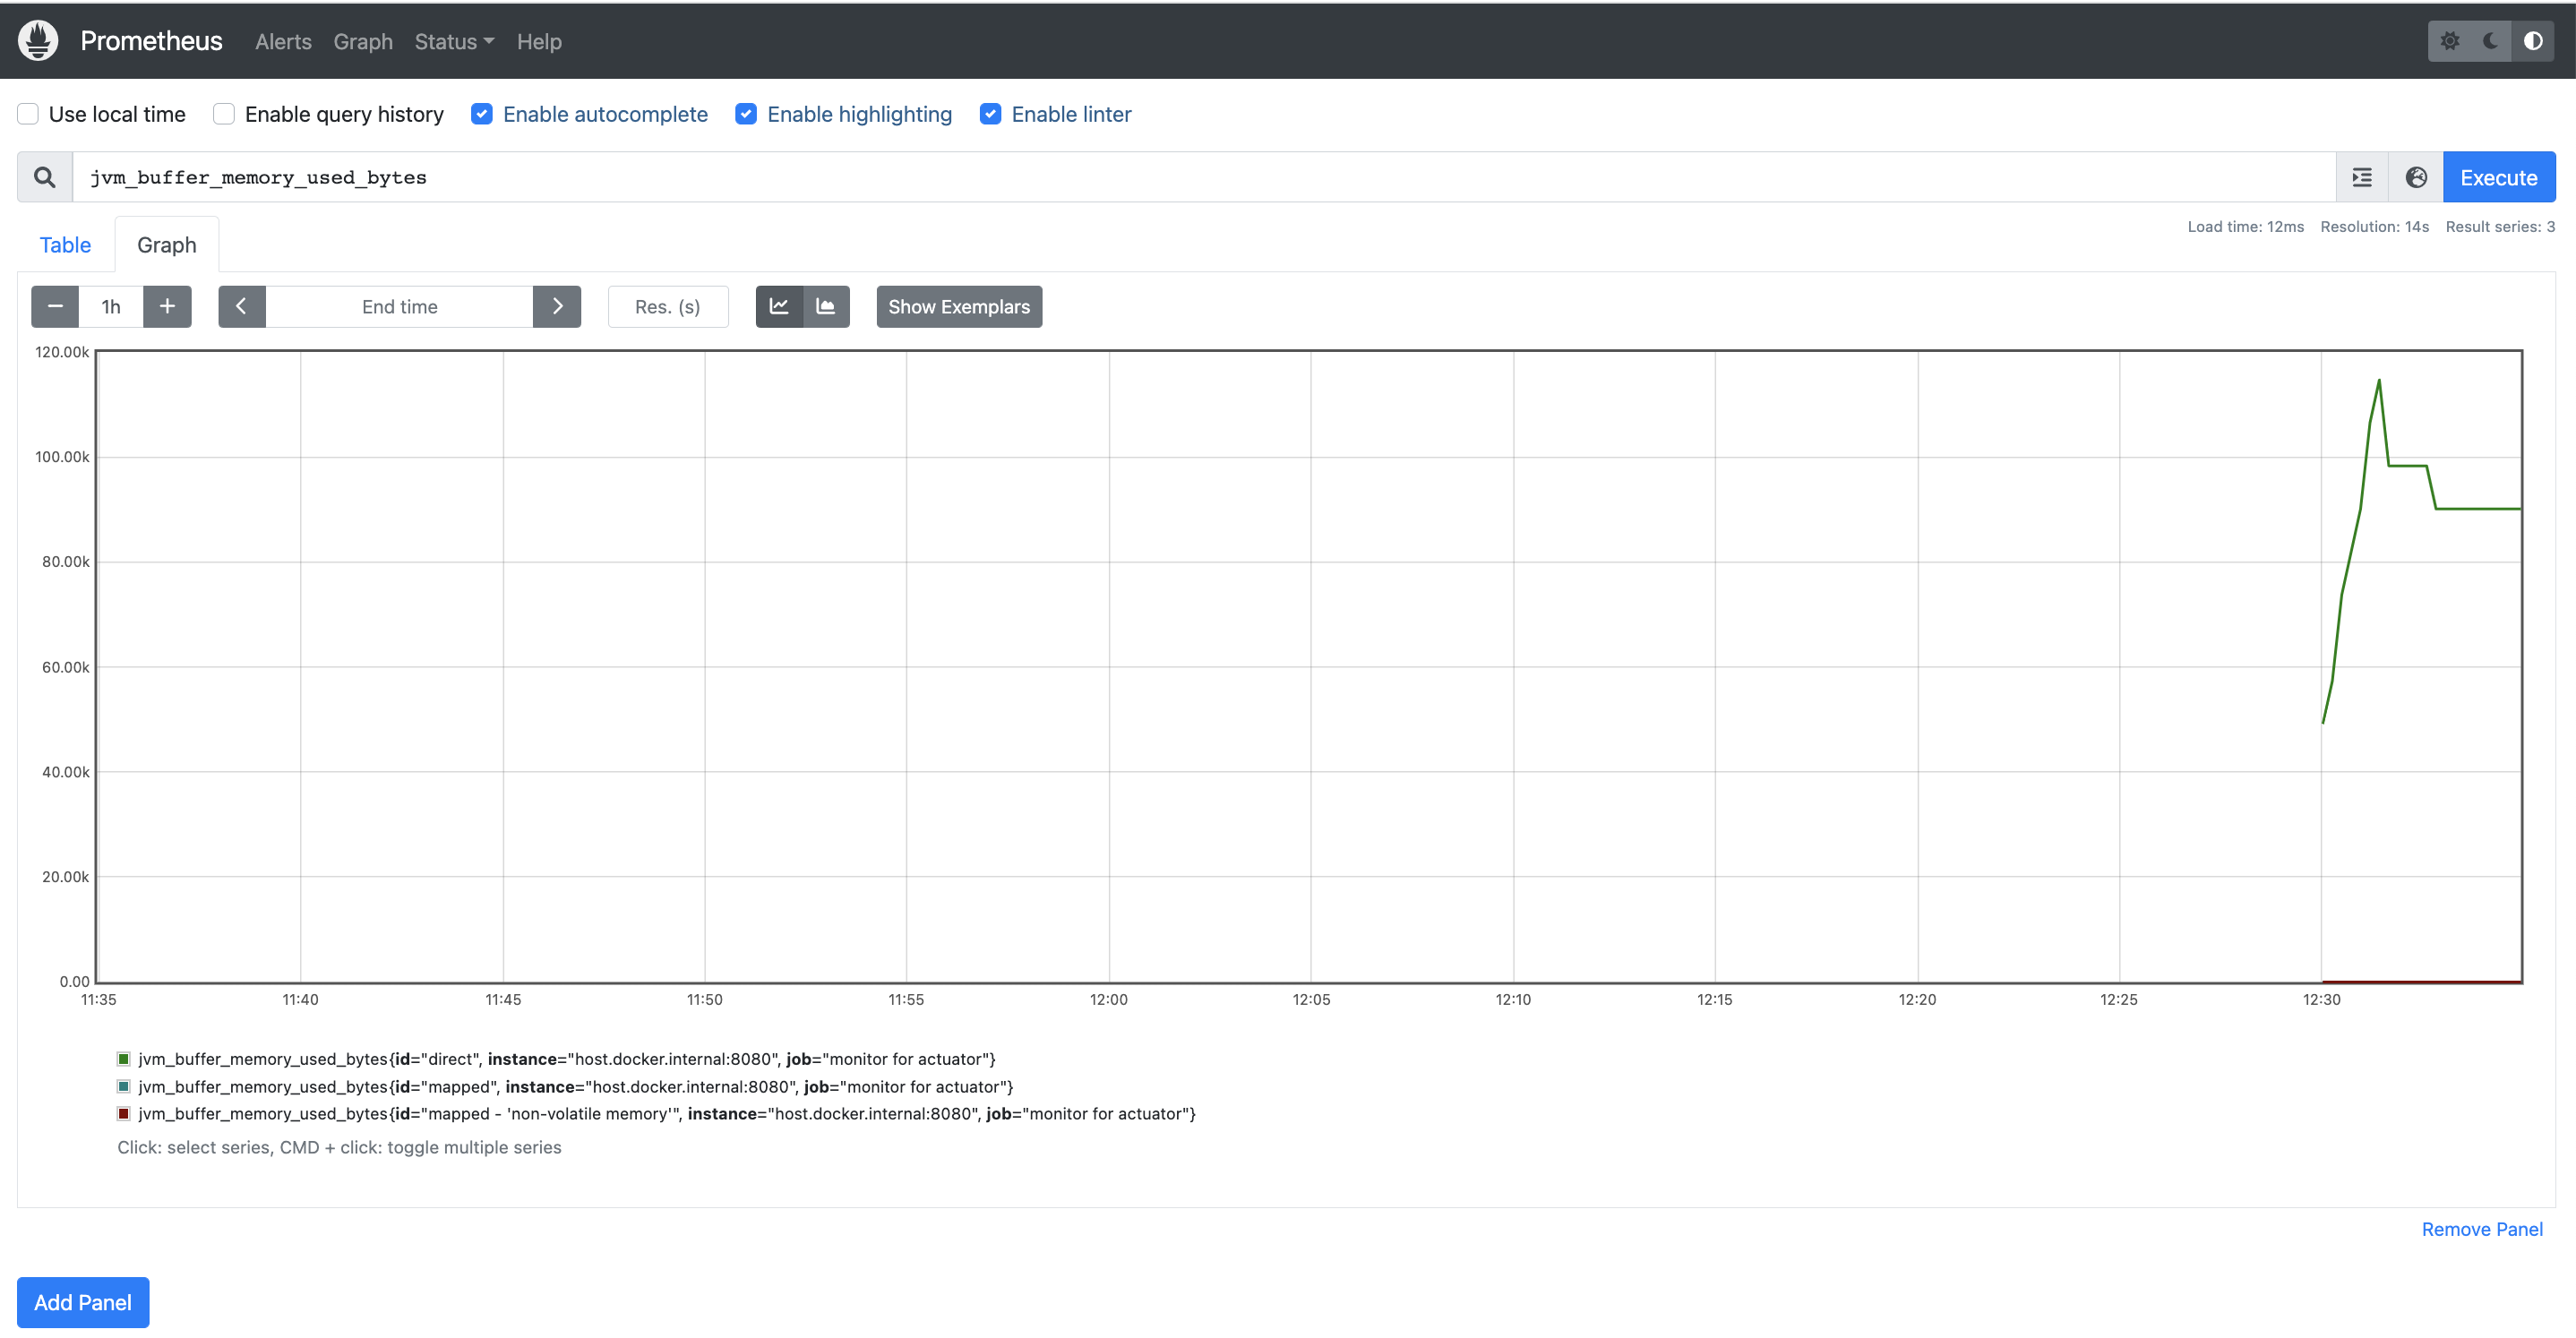
prometheus실행 후 http://localhost:9090 으로 접근하여 actuactor가 수집한느 다양한 값을 시각화하여 볼 수 있습니다. 아래는 application의 메모리 점유율을 표현하는 예시입니다.
댓글남기기